Tenant satisfaction survey results
Results of a yearly survey for tenant satisfaction from tenants whose homes or buildings we manage, using tenant satisfaction measures (TSMs) to rate our performance.
Tenant satisfaction measures (TSMs) help show how well we are doing at providing good quality homes and services. They help keep us focused on what we are doing well and where we need to improve. We get these from a yearly survey and from our own data as we carry out services.
We must publish results of a tenant satisfaction survey every year from people whose homes and buildings we manage and the management information data.
Summary of tenant satisfaction results April 2025 to March 2026
Overall tenant satisfaction is higher than last year.
Based on your feedback and our own data, we will focus on handling complaints better and making sure our homes meet the decent homes standard.
Tenant satisfaction survey results April 2025 to March 2026
We held the April 2025 to March 2026 survey between August and November 2025.
| What we asked tenants about | How many were satisfied in April 2025 to March 2026 | How many were satisfied in April 2024 to March 2025 | London median April 2024 to March 2025 |
|---|---|---|---|
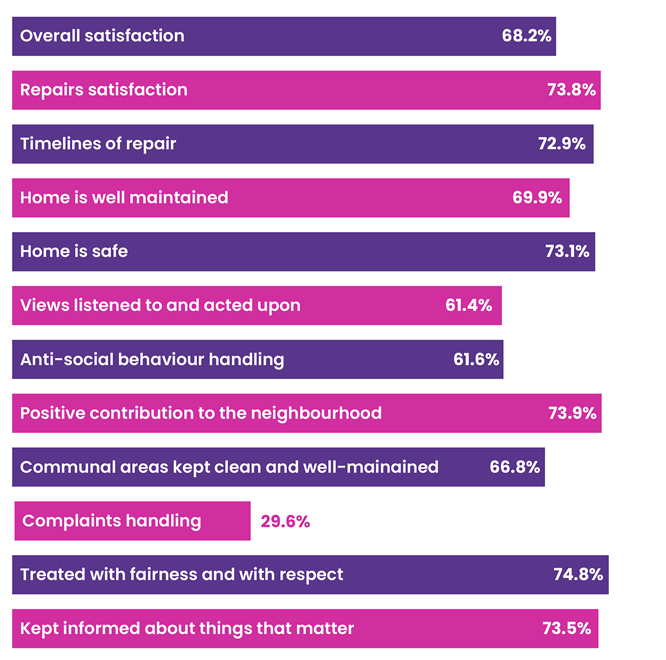
| Overall satisfaction | 68.2% | 66.5% | 62% |
| Repairs satisfaction | 73.8% | 69.9% | 65% |
| Time it took to finish most recent repair | 72.9% | 68.1% | 60% |
| Maintenance of your home | 69.9% | 68.3% | 63% |
| Safety of your home | 73.1% | 71.3% | 69% |
| If we listen to you and do something about it | 61.4% | 59.3% | 53% |
| If we keep you informed about things that matter | 73.5% | 72.5% | 70% |
| If we treat you fairly and with respect | 74.8% | 74.8% | 72% |
| Our approach to complaints | 29.6% | 25.3% | 26% |
| If we keep communal areas clean and maintain them | 66.8% | 67.3% | 63% |
| If we make a positive contribution to the neighbourhood | 73.9% | 70.8% | 65% |
| Our approach to handling anti-social behaviour | 61.6% | 60.6% | 59% |
How we collected and reported results of the survey this year
We have 25,378 low-cost rental accommodation household in Islington.
We completed 2,533 interviews from August to November 2025. We must collect at least 2,235 responses each year to make sure the data is accurate and that we are confident in our results.
We used Kwest to make calls by phone - this is cost-effective, quick and easy. It also made it simple to check that we got responses from a broad range of tenants.
Kwest called at least five times per household to try and get a response.
To find out more about how we gathered the data for the survey:
- read about our methodology for this year
- read the phone script and questionnaire we used for each tenant call
London median April 2024 to March 2025
The median has been calculated using the latest data published on 4 November 2025 by the Regulator of Social Housing - see the Tenant Satisfaction Measures on GOV.UK. The London median has been calculated from the London Local Authorities.
Management information measures
We gather data on 10 management information measures across four areas. We collect them in landlord and management data throughout the year.
Management information measures report April 2025 to March 2026
This report is for 1 April 2025 to 31 March 2026.
| Description of standard | Percentage or number for April 2025 to March 2026 | Percentage or number for April 2024 to March 2025 | London median April 2024 to March 2025 |
|---|---|---|---|
| Completed gas safety checks | 99.7% | 99.6% | 99.9% |
| Completed fire safety checks | 100% | 99.9% | 100% |
| Completed asbestos management surveys or reinspections | 99.9% | 88.6% | 100% |
| Completed legionella (bacteria carried in water) risk assessments | 99.8% | 99.9% | 100% |
| Completed passenger lift safety checks | 99.7% | 100% | 99.3% |
| Number of opened anti-social behaviour cases (per 1,000 properties) | 34.3 | 36.8 | 26 |
| Number of opened anti-social behaviour cases that involve hate incidents (per 1,000 properties) |
1 | 0.2 | 0.7 |
| Homes that do not meet the Decent Homes Standard | 9.2% | 4% | 7% |
| Non-emergency repairs we responded to completed within our target timescale | 83.7% | 76.4% | 83% |
| Emergency repairs completed within our target timescale | 94.8% | 94.7% | 94% |
| Number of Stage 1 complaints received (per 1,000 homes) | 93 | 68.1 | 73 |
| Number of Stage 2 complaints relative to the size of the landlord (per 1,000 homes) | 28.2 | 16.9 | 17 |
| Stage 1 complaints responded to within the Housing Ombudsman's Complaint Handling Code timescales | 87% | 62.4% | 71% |
| Stage 2 complaints responded to within the Housing Ombudsman's Complaint Handling Code timescales | 90% | 98.4% | 72% |
Decent Homes Standard and repair time targets
Find out more about the Decent Homes Standard.
- We have to complete repairs that are not emergencies in 28 days.
- Other non-emergency repair times include up to 60 days for legal disrepair, insurance, forced entry appointments for gas servicing, and 5 days for a repair recall.
- We have to complete emergency repairs in 24 hours.
- If there's an immediate threat to health or safety, we must complete a repair in 2 hours.
How we collect and report on our tenant satisfaction measures
Since the introduction of tenant satisfaction measures, we’ve put clear procedures in place to make sure we are giving accurate data to the Regulator of Social Housing.
We’ve worked closely with our teams across the council to improve data collection so that we are all reporting the same way, and we can compare our performance with other local authorities to see how we are doing and find areas to improve.
These include updates every quarter at meetings where we look at the data (these are called scrutiny meetings).